 Machine Learning with Log Analytics
Machine Learning and Artificial Intelligence are all the rage and for good reason. While static grouping and sorting in Azure Log Analytics can help you break down data and find the source of issues, Machine Learning can point out issues or unusual relationships you may not even be aware of. It does this by identifying patterns that are not obvious or by detecting differences in data sets. In this post I go over the basics of the Basket, Autocluster and Diffpatterns Machine Learning queries that can be use in Azure Log Analytics, Azure Application Insight or Azure Security Center.
I have to admit that I’m not a data scientist. The full potential of Machine Learning in Log Analytics is beyond what I can blog about. However, by applying the information below I was able to find that 29% of all Event Logs in a production environment were coming from one server and source. The issue was identified and quickly fixed based off this information machine learning provided. My intention is to pass along what I have learned so others can take advantage of Machine Learning.
The Basket Command
The Basket command finds patterns in data and returns all patterns based on a given threshold. This command leverages the Market Basket Analysis algorithm used by retailers to find associations between items customers purchase. For example, given 1000 different shopping carts, or “baskets”, what is the most frequent pattern of items purchased.
Applied to Log Analytics, Basket finds associations between records in a set of results. This opens the door to discovering different combinations of events that may not have been found or event considered using static searches. In the example below, I walk through a Basket search on Security Events to find interesting relationships.
First, I will run a quick search against the SecurityEvents table to identify the columns I want to analyze.
SecurityEvent
| where TimeGenerated >= ago(1h)
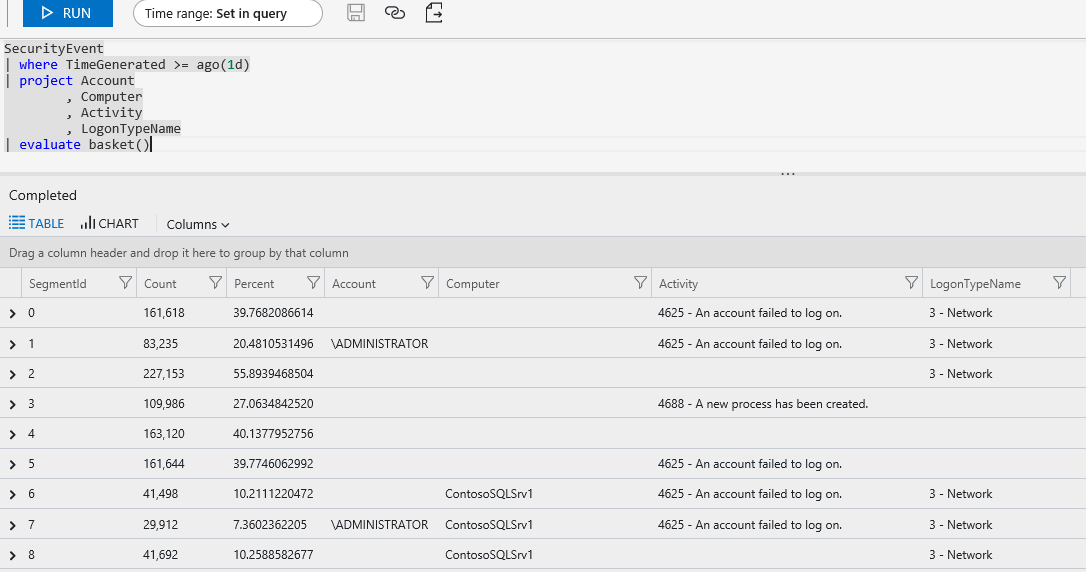
Out of the returned values, I project Account, Computer, Activity and logonTypeName. Projecting these values limits the data fields that will be evaluated. Once set, the results are piped to a command that evaluates the results with the basket command. I also change the evaluation time from one hour to one day. The complete command looks like this:
SecurityEvent
| where TimeGenerated >= ago(1d)
| project Account
        , Computer
        , Activity
        , LogonTypeName
| evaluate basket()
The results from the Log Analytics demo site are shown below. One item that stands out right away is the number of failed administrator account logins from the network indicated in SegmentId 2.
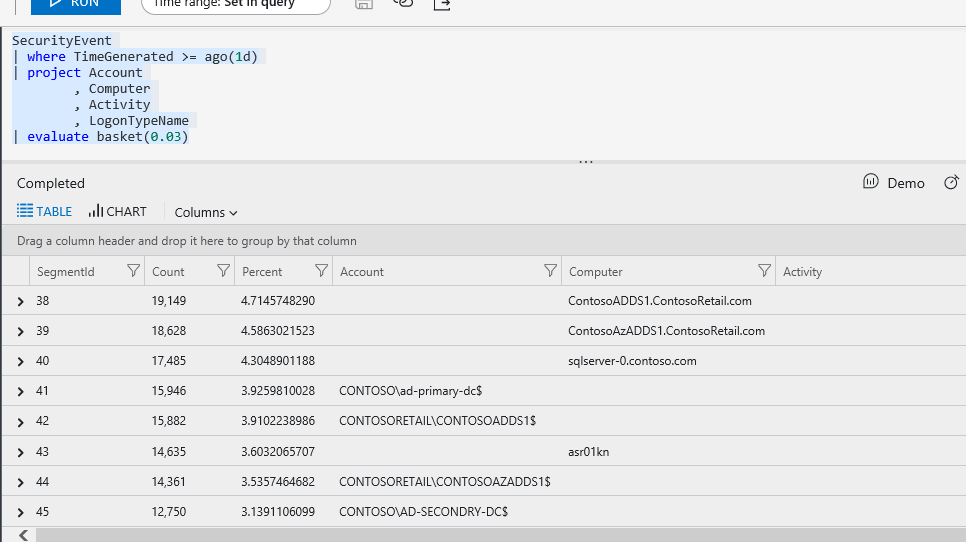
The Basket command has a few optional arguments that can tweak the output of the command. One of them is the Threshold. Threshold sets the minimal ratio of rows considered as frequent. Essentially, the lower the number the more rows returned. The value is a double less than 1, with the default set to 0.05. For example, at default my example returns 24 rows, changing to 0.03 returns 45. More information on the different arguments can be found here
SecurityEvent
| where TimeGenerated >= ago(1d)
| project Account
       , Computer
        , Activity
        , LogonTypeName
| evaluate basket(0.03)
The Autocluster Command
While the Basket command finds all frequent patterns in data, Autocluster finds frequent patterns in the data and reduces the results to a smaller number of patterns. This works well for analyzing data like Event Logs to focus on more frequent patterns. In the example below, I run Autocluster against the Update table for the past 24 hours. Below is the output.
Update
| where TimeGenerated >= ago(1d)
| project Computer
        , UpdateState
        , Product
        , OSType
| evaluate autocluster()
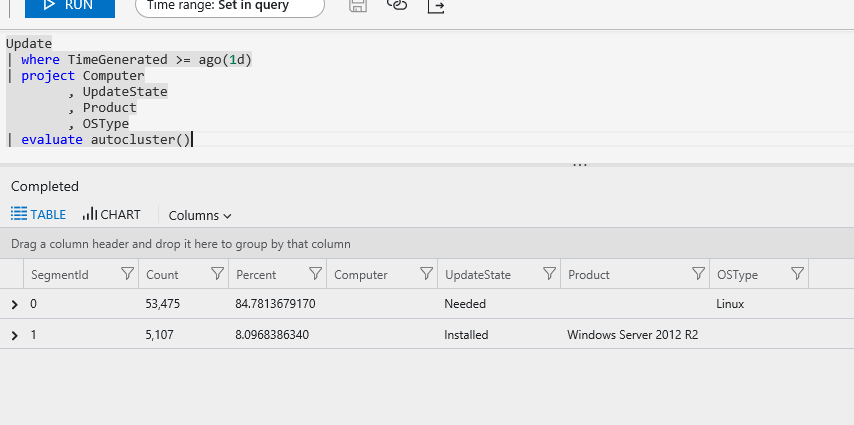
You can see that it only returned two rows. Like Threshold in the Basket command, Autocluster has a SizeWeight argument. SizeWeight adjusts the balance between generic results with a smaller number of rows returned and more refined results with a higher number of distinct patterns. The value is a double less than 1. You can get more details and the additional parameters here.
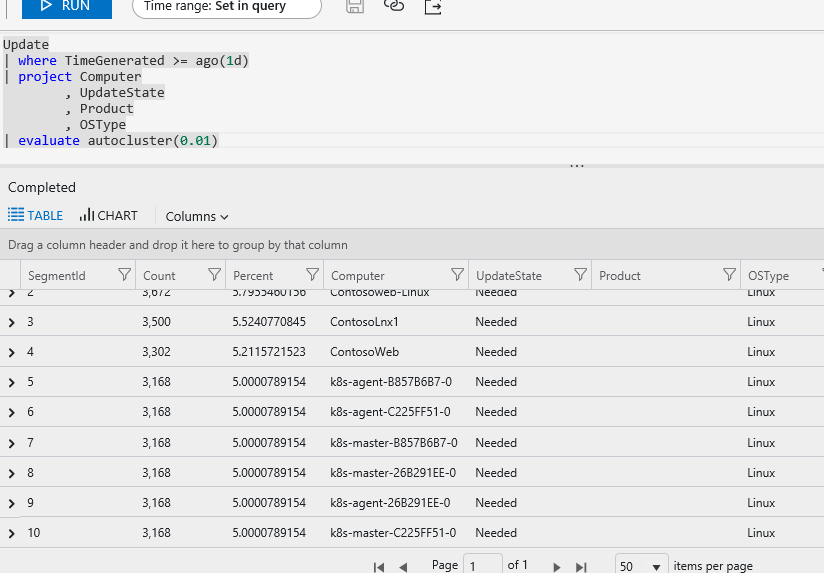
In the example below, I run the same command, changing the sizeWeight from the default of 0.5 to 0.1. With that change 10 rows are returned with a more informative breakdown of the computers needing updates.
The Diffpatterns Command
Diffpatterns finds differences in data sets of the same structure. While the other commands try to find relationships, Diffpatterns finds differences in a dataset. Quite Honestly, I find this one is easier demonstrated than explained.
I set out to view the difference between Errors and Warnings in the Event Log in this example. This is done by starting a query setting the time, filtering the EventLevelName to return two items, Error and Warning and projecting EventLevelName and Computer.
Next comes the evaluate diffpatterns() command. This command requires three arguments. The first is SplitColumn, or the column with data to be compared. Next is SplitValueA, or the first value specified for comparison. The value is represented as a string and considered data set A. In this query, data set A represents Warning.
The last required argument is SplitValueB. This is the second set of data compared and represents Error as data set B in the results. Below is the full query.
Event
| where TimeGenerated >= ago(7d)
and EventLevelName == "Warning" or EventLevelName == "Error"
| project EventLevelName
        , Computer
| evaluate diffpatterns(EventLevelName, "Warning", "Error")
The output gives the percent difference between Warning (PercentA) and Error (PercentB) as represented by computer under the PercentDiffAB column.

Here is another diffpatterns query for illustration. This time with the SecurtyEvent table. I am comparing Event number 4624 and 4625, Windows login success and failure.
Two things stand out about this command. First, the event ID’s are an integer, but have been evaluated as a string, surrounding them with quotes. This is because a string is required for the split data.
Also, the first 3 arguments (SplitColumn, SplitValueA and SplitValueB) are required, but the command accepts additional optional arguments. These parameters are positional, use the “~” as a Null or Default value. In the example below, the 4th value is WeightColumn, I don’t want to modify that value so I added a “~”. The fifth value is threshold (similar to threshold in the Basket command). Below, the value changed from the default of 0.05 to 0.02.
SecurityEvent
| where TimeGenerated >= ago(1d)
and EventID == 4624 or EventID == 4625
| project Account
        , Computer
        , EventID
        , Activity
| evaluate diffpatterns(EventID, "4624", "4625", "~", 0.02)
In this example we can see there was a 23.28% difference between success (PercentA) and failed (PercentB) logins for computer ContosoSQLSrv1

More information on the Difpatterns command and attributes are located here.
If you would like to learn more about querying in Azure Log Analytics I recommend the Pluralsight course on the Kusto Query Language (KQL). Microsoft is offering the course for free at the time of writhing this post.


1 thought on “Azure Machine Learning in Log Analytics”
This is super cool. Thanks!