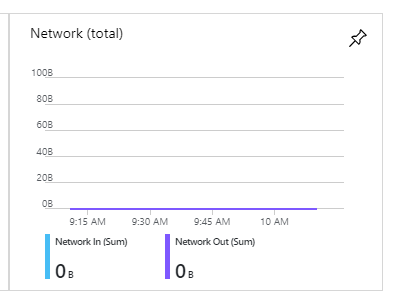
 This week I noticed an issue with no data showing in the Azure Network (Total), Network Out (Sum) and Network In (Sum) tile in the Azure Virtual Machine Overview. I recall noticing this before but couldn’t remember how long ago that was. Looking at other VM’s, most of my them were missing the Network Total information. The only servers that were showing data are virtual firewall appliances.
The first correlation I made was that VM’s not showing overview network data were sending performance data to a Log Analytics Workspace. The ones that showed data in the VM Overview did not have the Azure Monitor Agent installed. I modified the default performance counters, maybe I didn’t have the correct counters added and the tile had nothing to pull from Log Analytics? The Overview Tile only indicates Network In (Sum), Network Out (Sum) and Network (Total). None of these are valid performance counters in Log Analytics. I tried similar counters such as Network Interface and Network Adapter, no luck.
Search results returned little information so I opened a case with Microsoft. Turns out, the Network (Total) and sum for In and Out only show network traffic that is charged by Microsoft. As I mentioned, there is a firewall appliance in this environment that acts as a gateway for all internet and VPN traffic to other sites. Those were reporting traffic because all billable traffic passes through these devices. The Log Analytics correlation I made earlier was just a coincidence.
It’s worth noting that in addition to not showing data, this would cause a deviation in network utilization reported by Azure System and performance data collected by the Azure Management Agent. The first being billable traffic while the second is the actual network traffic for the VM.


2 thoughts on “No Data in Network Overview Tile”
Thank you for posting this. I’ve been stumped for the last few days on this one.
I was seeing the exact same thing and also some VMs with intermittent bursts of traffic, but then they would return to 0 bytes even though they were up and running fine (ie. no background traffic, which is not normal). VMs in the same VNet as our Domain Controllers and other foundation servers had the problem worst, but that must be because their background comms is within the VNet and hence not billable. Those in other VNets are billable when they communicate with these foundation servers as they are crossing a VNet boundary and hence the traffic becomes billable.
It would be good if MS had labelled these metrics accordingly, since this simple (once you know) fact is not intuitive at all
So… now off to find a metric which tells the whole story rather than just part of it…
Thanks again
Thanks, glad I could help. If you’re looking to collect performance data at the VM level I have a playlist on YouTube for setting up a Log Analytics work space that may be of interest. https://www.youtube.com/playlist?list=PLnWpsLZNgHzVXXyN9a0jm9xNNDrikHf8I